Single Table Synthesis
|
The full source code for this example is available to download for Spark code (here) and for Pandas code (here) along with the example dataset. |
In this tutorial the most important features of the Synthesized SDK are explained using examples of a complete end-to-end generation of synthetic data from an original dataset. The examples demonstrate how an end-to-end synthesis can be achieved using the default parameters, as well as going into more detail on how non-default settings can be configured by the user at each stage of the process. The generative models leveraged by the SDK have been tuned on a wide variety of datasets and data types, meaning that the "out-of-the-box" behaviour of the SDK is performant and produces synthetic data statistically similar to the original. However, where custom scenarios and constraints are required a user can define a custom configuration when using the SDK.
Fitness Dataset
This example will use a modified public dataset from Kaggle detailing the attendance of a range of fitness classes available at a gym:
-
Pandas
-
Spark
import pandas as pd

df = pd.read_csv("fitness_data.csv")

df
booking_id months_as_member weight days_before day_of_week time category attended membership 0 1 17 79.56 8 3 PM Strength 0 Anytime 1 2 10 79.01 2 1 AM HIIT 0 Anytime 2 3 16 74.53 14 7 AM Strength 0 Weekend 3 4 5 86.12 10 5 AM Cycling 0 Anytime 4 5 15 69.29 8 4 AM HIIT 0 Anytime ... ... ... ... ... ... ... ... ... ... 1495 1496 21 79.51 10 5 AM HIIT 0 Anytime 1496 1497 29 89.55 2 1 AM Strength 0 Anytime 1497 1498 9 87.38 4 2 AM HIIT 0 Anytime 1498 1499 34 68.64 14 7 AM Aqua 0 Weekend 1499 1500 20 94.39 8 4 AM Cycling 1 Anytime [1500 rows × 9 columns]
When using Spark, normally data would be pulled from a delta lake or similar data source with well-defined schemas that Spark can derive a correct schema from. To make this tutorial standalone, a CSV file of data is used, however since CSV files do not store schemas they need to be manually specified in this tutorial.
import pyspark.sql as ps
import pyspark.sql.types as st

# Create Spark Session here - connect to a cluster. If using databricks this parameter exists automatically so skip
spark = ps.SparkSession.builder.master("local[1]").appName("synthesized-single-table-tutorial").getOrCreate()

schema = st.StructType([
    st.StructField(name="booking_id", dataType=st.IntegerType()),
    st.StructField(name="months_as_member", dataType=st.IntegerType()),
    st.StructField(name="weight", dataType=st.FloatType()),
    st.StructField(name="days_before", dataType=st.IntegerType()),
    st.StructField(name="day_of_week", dataType=st.IntegerType()),
    st.StructField(name="time", dataType=st.StringType()),
    st.StructField(name="category", dataType=st.StringType()),
    st.StructField(name="attended", dataType=st.IntegerType()),
    st.StructField(name="membership", dataType=st.StringType()),
])

df = spark.read.csv("fitness_data.csv", header=True, schema=schema)

df.show(10)
df.printSchema()
+----------+----------------+------+-----------+-----------+----+--------+--------+----------+ |booking_id|months_as_member|weight|days_before|day_of_week|time|category|attended|membership| +----------+----------------+------+-----------+-----------+----+--------+--------+----------+ | 1| 17| 79.56| 8| 3| PM|Strength| 0| Anytime| | 2| 10| 79.01| 2| 1| AM| HIIT| 0| Anytime| | 3| 16| 74.53| 14| 7| AM|Strength| 0| Weekend| | 4| 5| 86.12| 10| 5| AM| Cycling| 0| Anytime| | 5| 15| 69.29| 8| 4| AM| HIIT| 0| Anytime| | 6| 7| 93.33| 2| 1| AM| Cycling| 0| Anytime| | 7| 11| 88.59| 6| 3| PM| HIIT| 0| Anytime| | 8| 9| 89.52| 10| 5| AM| HIIT| 0| Anytime| | 9| 23| 71.12| 10| 5| AM| HIIT| 1| Anytime| | 10| 7| 81.25| 10| 5| AM| HIIT| 0| Anytime| +----------+----------------+------+-----------+-----------+----+--------+--------+----------+ only showing top 10 rows root |-- booking_id: integer (nullable = true) |-- months_as_member: integer (nullable = true) |-- weight: float (nullable = true) |-- days_before: integer (nullable = true) |-- day_of_week: integer (nullable = true) |-- time: string (nullable = true) |-- category: string (nullable = true) |-- attended: integer (nullable = true) |-- membership: string (nullable = true)
This dataset has a number of interesting features:
-
The column
booking_idis an enumerated column, i.e. it increases in constant sized steps from a starting value -
The column
day_of_weekcommunicates what day of the week the class was held, but as an integer -
There is a
membershipcolumn, communicating what type of plan the member is on-
"Anytime" members can attend classes on any day of the week
-
"Weekend" members can only attend classes on a Saturday or Sunday
-
This tutorial will demonstrate how the SDK can be used create synthetic data with the
same statistical fidelity as the original dataset, and new values of booking_id in order to supplement the original data.
This is a common task within an organisation, especially where the volume of the original dataset is small.
Before any synthetic data is generated, it is best practice to perform some exploratory data analysis (EDA) to gain a deeper understanding of the dataset. For example, EDA could be done to determine whether there are missing values, understand the distribution of outliers or calculate/plot any univariate and multivariate statistics that may aid in the development of any hypothesis testing. This is by no means a comprehensive list of techniques and tools encompassed within EDA and the actual EDA process is highly individual and dependent on how the synthetic data will be leveraged downstream.
Simple Synthesis
The fastest way to get up and running with the SDK is using the Python API functions train and generate.
First, create and train a Synthesizer with the train function:
from synthesized3.api import train

synth = train(df)
Training epoch 117 loss=0.25 Training Complete.
Second, generate Synthetic data using the generate function:
-
Pandas
-
Spark
from synthesized3.api import generate

df_synth = generate(synth, num_rows=1000)

df_synth
booking_id months_as_member weight days_before day_of_week time category attended membership 0 547 9 NaN 10 7 AM HIIT 0 Anytime 1 955 27 NaN 14 7 PM HIIT 0 Weekend 2 798 7 NaN 10 5 AM Yoga 0 Weekend 3 697 6 NaN 4 5 PM - 0 Anytime 4 805 10 NaN 10 5 AM HIIT 0 Anytime .. ... ... ... ... ... ... ... ... ... 995 177 11 NaN 8 5 AM Cycling 0 Anytime 996 713 12 NaN 10 6 AM HIIT 0 Anytime 997 702 15 NaN 10 5 AM Strength 1 Anytime 998 559 11 NaN 6 3 AM HIIT 0 Anytime 999 770 20 NaN 6 2 AM Strength 1 Anytime [1000 rows x 9 columns]
from synthesized3.api import generate

df_synth = generate(synth, 1000, spark=spark)

df_synth.show(10)
+----------+----------------+------+-----------+-----------+----+--------+--------+----------+ |booking_id|months_as_member|weight|days_before|day_of_week|time|category|attended|membership| +----------+----------------+------+-----------+-----------+----+--------+--------+----------+ | 484| 7| null| 10| 4| AM| HIIT| 0| Anytime| | 679| 18| null| 10| 7| AM| Cycling| 0| Anytime| | 882| 12| null| 7| 4| AM|Strength| 0| Anytime| | 808| 13| null| 10| 6| AM| HIIT| 0| Anytime| | 727| 20| null| 8| 5| AM| HIIT| 0| Anytime| | 825| 13| null| 6| 3| AM| HIIT| 0| Anytime| | 353| 7| null| 10| 6| AM| HIIT| 0| Anytime| | 1175| 22| null| 8| 4| PM| HIIT| 1| Anytime| | 747| 21| null| 4| 1| AM|Strength| 1| Weekend| | 890| 10| null| 10| 4| AM|Strength| 0| Anytime| +----------+----------------+------+-----------+-----------+----+--------+--------+----------+ only showing top 10 rows
Model and Meta inspection
Internally the train function above performs a few steps, including extraction of metadata about each column in the
dataset and deciding how each column is to be modelled. It is possible to overwrite the default values by supplying
the train function with a SynthesizerConfig object. Before providing an override though (next section),
the default meta information can be inspected as follows:
Meta inspection
metas = synth.meta_collection.metas
print("Metas:")
for meta in metas:
    print(meta)
Metas: booking_id: LongMeta months_as_member: LongMeta weight: DoubleMeta days_before: LongMeta day_of_week: LongMeta time: CategoricalMeta category: CategoricalMeta attended: LongMeta membership: CategoricalMeta
In the next section it is demonstrated how to get the Synthesizer to treat one or more of these columns differently
(e.g. to treat day_of_week as a category, or attended as a boolean).
Model inspection
The default models to be used can be inspected similarly:
models = synth.model_collection.models
print("Models:")
for model in models:
    print(model)
Models: ['attended', 'booking_id', 'category', 'day_of_week', 'days_before', 'membership', 'months_as_member', 'time', 'weight', 'weight_missing_values']: DeepTableModel
All columns are being modelled by the DeepTableModel.
In the next section it is demonstrated how to get the Synthesizer to model one or more columns differently
(e.g. to make the synthetic booking_id column be systematically generated in a sequential order, an
EnumerationModel can be used).
Model and Meta overrides
The default Models and Metas of the Synthesizer can be overwritten by supplying the train function with a
SynthesizerConfig object with custom Model and Meta specifications. The whole SynthesizerConfig configuration can
be specified in a YAML file and loaded in, or specified via the Python API. Both setups are demonstrated below.
Meta overrides and Model overrides (for one or multiple columns) can be specified in one SynthesizerConfig
configuration, or just one can be specified if only one is required.
In the example below, both are specified in one config.
In this example a Meta override is used to specify that the attended column should be treated as a boolean,
and a Model override is used to specify that the booking_id column should be modelled using an EnumerationModel
(which systematically generates values in a sequential order with a fixed step size).
-
YAML
-
Python
# config.yaml file
train:
  meta_overrides:
    attended: BooleanMeta
  model_overrides:
    - columns:
        - booking_id
      type: EnumerationModel
      kwargs:
        start: 1000
# Python script
import yaml
from synthesized3.api import load_and_validate_config
with open("config.yaml") as f:
config = yaml.safe_load(f)
synth_config = load_and_validate_config(config)
synth = train(df, synth_config)from synthesized3.schema import SynthesizerConfig
synth_config = SynthesizerConfig(
train={
"meta_overrides": {
"attended": "BooleanMeta",
},
"model_overrides": [
{"columns": ["booking_id"],
"type": "EnumerationModel",
"kwargs":{"start": 1000}},
],
}
)
synth = train(df, synth_config)The Metas being used can be inspected as before:
print(synth.meta_collection["attended"])attended: BooleanMeta
It can be seen that attended now has a BooleanMeta.
The Models being used can be inspected as before:
for model in synth.model_collection.models:
    print(model)
['booking_id']: EnumerationModel ['attended', 'category', 'day_of_week', 'days_before', 'membership', 'months_as_member', 'time', 'weight', 'weight_missing_values']: DeepTableModel
It can be seen that booking_id is now being modelled with an EnumerationModel.
Generating data from this synthesizer gives output like the following:
   booking_id  months_as_member  weight  days_before  day_of_week time  category  attended membership
0        1000                 8     NaN            9            2   AM   Cycling         1    Anytime
1        1001                14     NaN           10            5   AM   Cycling         0    Weekend
2        1002                15     NaN            8            3   PM  Strength         0    Anytime
3        1003                16     NaN           10            5   PM   Cycling         1    Anytime
4        1004                 9     NaN            8            3   AM  Strength         0    Weekend
5        1005                12     NaN           12            7   PM      HIIT         1    Weekend
6        1006                13     NaN            7            1   PM         -         1    Anytime
7        1007                13     NaN           10            6   PM      HIIT         0    Anytime
8        1008                15     NaN           10            5   PM      Yoga         0    Anytime
9        1009                 7     NaN            8            1   AM      HIIT         0    Anytime
It can be seen that the booking_id column does indeed have values enumerating from 1000 (specified in the config)
in step sizes of 1 (the default).
Evaluation
|
In this section it is assumed the Synthesized pip install insight Further explanations and documentation of the |
When evaluating the quality of synthetic data, there are generally three perspectives to consider:
-
Statistical Quality
-
Predictive Utility
-
Privacy
It is recommended best practice to evaluate the statistical quality of the synthetic data (i.e. its fidelity compared to the original data) before considering other metrics, to ensure that the synthetic data quality meets the requirements of the user.
Here, the focus will be on evaluating only the statistical quality of the synthetic data.
|
The evaluation code currently utilises Pandas exclusively, so any Spark dataframes will need to be converted to Pandas dataframes before running the code in this section (both raw and synthetic dataframes). This can be done in 1 line of code: df_pandas = df_spark.toPandas() This will collect the entire dataframe on the host node. If the dataframe is too large to fit on the host node, take a representative sample of the data before converting to Pandas dataframe. A representative data sample will have the same statistical patterns and correlations as the population, meaning any comparisons done will still be valid. A random sample can be taken and converted to a Pandas dataframe using the following code: fraction_of_data_to_sample = 0.05 df_pandas = df_spark.sample(fraction_of_data_to_sample).toPandas() |
A simple first step is to analyse whether similar numbers of missing values are present in the original and synthetic dataframes. Where there are no missing values in the original, it should be confirmed there are none in the synthetic.
pd.concat([df.isna().sum(), df_synth.isna().sum()], axis=1, keys=["original_nan_count", "synthetic_nan_count"])original_nan_count synthetic_nan_count booking_id 0 0 months_as_member 0 0 weight 20 28 days_before 0 0 day_of_week 0 0 time 0 0 category 0 0 attended 0 0 membership 0 0
Next, the Synthesized insight package will be utilized in order to compare the univariate and bivariate statistics
across the synthetic and original datasets. As an initial sanity check, the distributions of the continuous and
categorical features in the original and synthetic datasets are visually compared (excluding the "booking_id" feature
since this is an enumerated unique ID):
import insight.plotting as p
fig = p.plot_dataset([df, df_synth])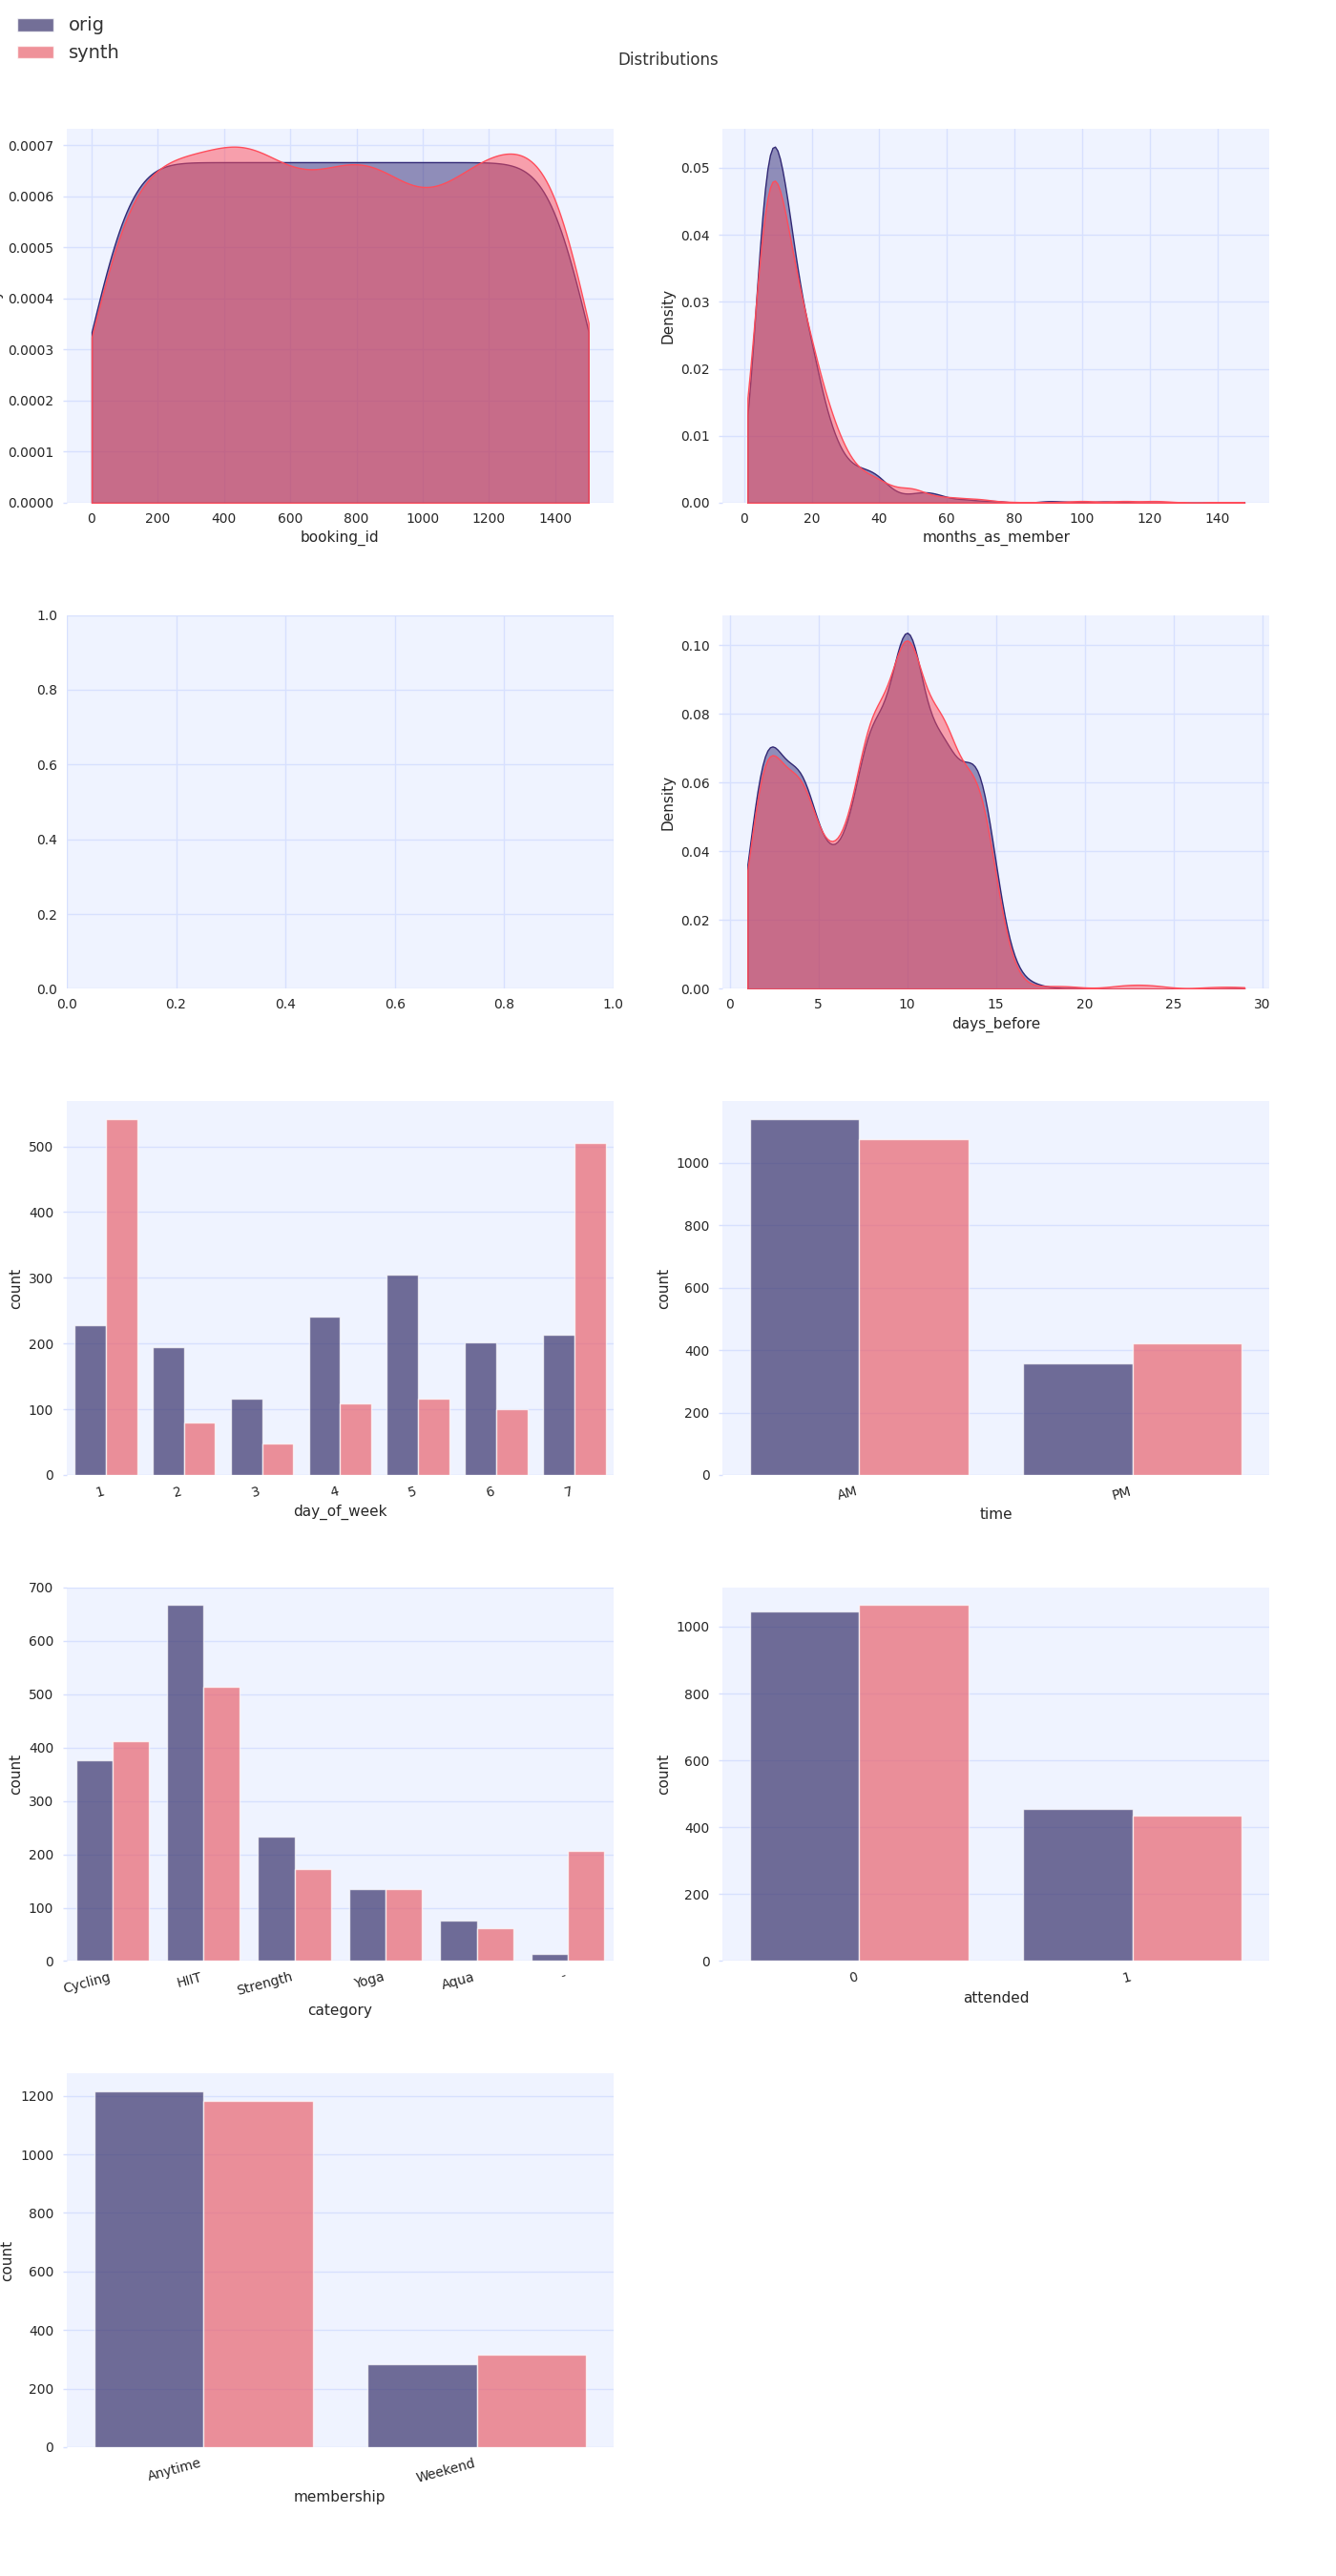
A quick visual inspection confirms that the synthetic data is qualitatively similar to the original, however by calculating appropriate distances between distributions in the two datasets the user can better quantify the statistical quality of the data. For categorical distributions, for example, the Earth Mover’s distance can be calculated:
import insight.metrics as m
emd = m.EarthMoversDistance()
emd(df["category"], df_synth["category"])
0.152
|
The above analysis should not be considered exhaustive and the evaluation of the statistical quality of the data should be informed by the downstream problem at hand and the EDA of the original dataset prior to any synthesis jobs being run. |