Data Evaluation
At Synthesized we have spent a lot of time thinking about how to evaluate synthetic data. We appreciate users will likely want to do the same, so we created a template evaluation framework as a starter-for-10 that should include the essential features users might want to evaluate, approaching the task in a thorough, logical manner and explaining how to evaluate the various points. See Product Evaluation Framework and Data Evaluation Framework.
The Synthesized SDK includes several methods to assess the privacy, quality and utility of generated data. These can be used to answer several related questions, including:
-
Privacy: how much sensitive and private information from the original data can be extracted from the generated data?
-
Statistical Quality: does the generated data closely resemble the original data, and maintain the statistical properties and correlations?
-
Predictive Utility: does the generated data maintain the predictive performance for an ML classification/regression task?
Assessor
As a first step when evaluating synthetic data, the Assessor is a good place to start.
The Assessor allows the quick plotting of raw vs. synthetic data to visually inspect and verify that the
base patterns of the raw data are correctly reproduced by the synthetic data, and gives the first line of confidence
in the synthetic dataset.
Assessor requires a DataFrameMeta class extracted from the original data-frame, and can be created with
these commands:
from synthesized import MetaExtractor
from synthesized.testing import Assessor

df_meta = MetaExtractor.extract(df)
assessor = Assessor(df_meta)
Once the Assessor object has been created it can be used to compare marginal distributions, joint distributions
and classification metrics between two data-frames (usually the original and generated data-frames, df_orig
and df_synth).
Comparing Marginal Distributions
show_distributions plots all marginal distributions in two datasets,
assessor.show_distributions(df_orig, df_synth)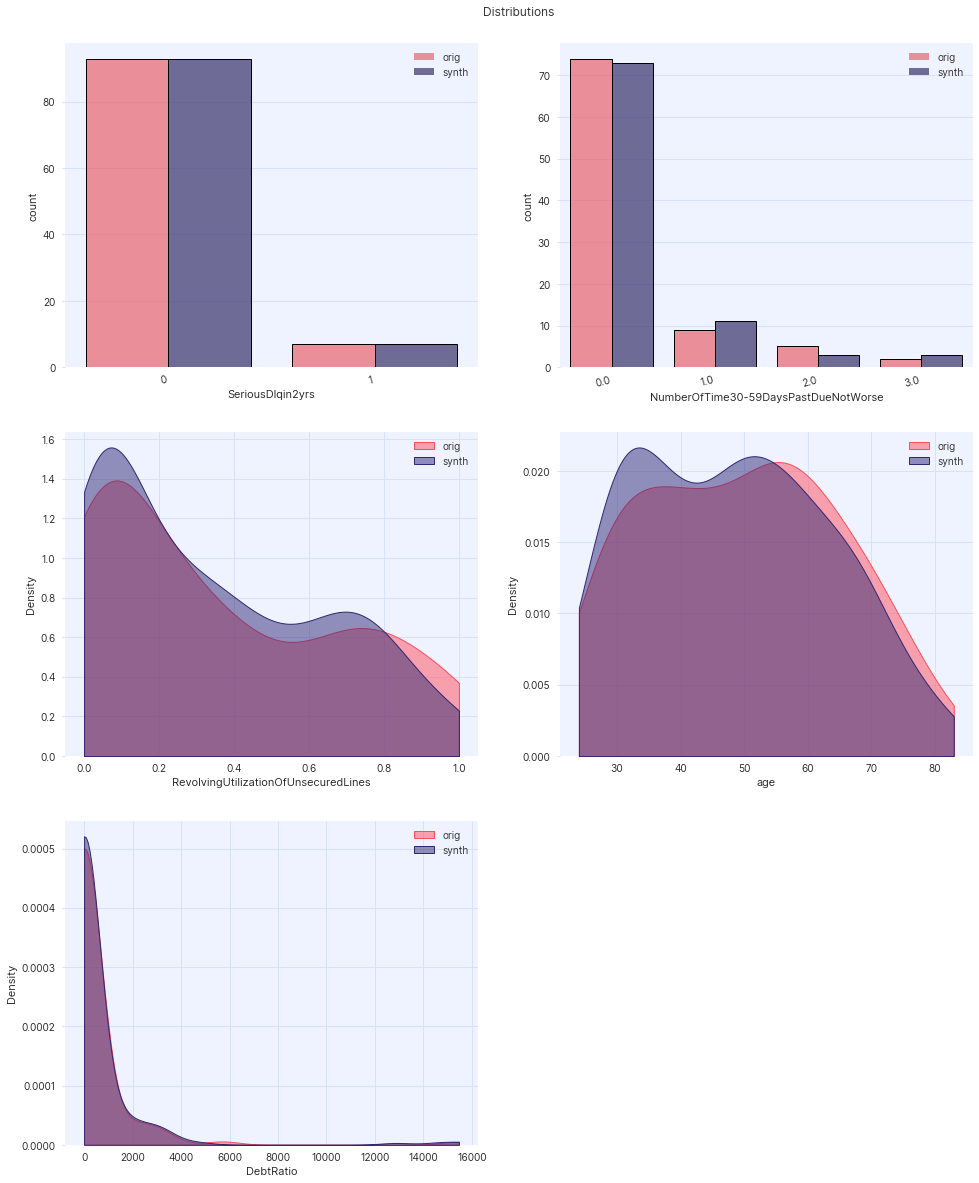
Example plot for assessor.show_distributions().
The 'Assessor' has a variety of additional functionalities, including metrics and plots to compare joint distributions,
as well as more complex capabilities.
See Statistical Quality for full details of the Assessor.