Event-Based Synthesis
|
The full source code for this example is available for download here along with the example dataset. |
Prerequisites
This tutorial assumes that you have already installed the Synthesized package. While it is not required to have read the single table synthesis tutorial, it is highly recommended that you do so, as it outlines best practices when generating and evaluating synthetic data. It is assumed that you are also familiar with the format of a dataset with temporal correlations as laid out in the documentation.
Introduction
In this tutorial, the EventSynthesizer is introduced as a means to generate a dataset where there is a temporal component.
In particular, the EventSynthesizer is used where there are irregular time intervals between consecutive events or measurements.
In the time series tutorial the TimeSeriesSynthesizer was introduced as a means of generating
data with a regular interval between events. This model excels at learning the correlations between temporal features and measurements
(e.g. between the day of the week and the number of workers at an office). The EventSynthesizer is a complementary model that
learns relationships between events in processes, focussing in particular on the correlations between a sequence of events and the
interval between the events (e.g. that if event A occurs then event B is likely to occur 3 days later).
Patient Pathways
In this tutorial, the EventSynthesizer will be trained with a patient pathway dataset, detailing a sequence of events for around 20
patients as well as their age and gender. This dataset has been modified from a publicly available one on Kaggle.
import pandas as pd
df = pd.read_csv("restricted_patient_pathways.csv")
df
UID Age Gender Date Event_Code 0 Id_e45a846f 26 M 2011-02-01 V035 1 Id_e45a846f 26 M 2011-02-01 8830 2 Id_e45a846f 26 M 2011-02-01 0549 3 Id_e45a846f 26 M 2011-02-01 0539 4 Id_e45a846f 26 M 2011-02-01 5276 ... ... ... ... ... ... 359 Id_e45d67f9 63 M 2013-06-01 4610 360 Id_e45d67f9 63 M 2013-06-01 9921 361 Id_e45d67f9 63 M 2013-06-01 V035 362 Id_e45d67f9 63 M 2013-06-01 9921 363 Id_e45d67f9 63 M 2013-11-01 5276 [364 rows × 5 columns]
As with every use case, it is best practice to perform an exploratory data analysis (EDA) prior to using any of the features of the SDK. In a dataset such as this, EDA may involve some form of process mining to understand details of each patient’s event log. For many tasks it is unnecessary to obtain a full process map and it suffices to identify aggregated features such as the most frequent start and end events, possible pairs of consecutive events and average path lengths. In this case, all event logs begin with the same event:
df.groupby("UID").head(1)UID Age Gender Date Event_Code 0 Id_e45a846f 26 M 2011-02-01 V035 21 Id_e45af97e 60 M 2011-02-01 V035 36 Id_e45c0a2a 51 M 2011-04-01 V035 54 Id_e45c3054 43 M 2011-03-01 V035 72 Id_e45c56f9 29 M 2011-04-01 V035 92 Id_e45c5768 70 F 2011-04-01 V035 110 Id_e45ca513 43 F 2011-04-01 V035 127 Id_e45ca516 50 F 2011-07-01 V035 146 Id_e45ca518 56 F 2011-12-01 V035 169 Id_e45ca521 61 M 2011-10-01 V035 186 Id_e45ca555 22 F 2013-04-01 V035 204 Id_e45ccbe5 39 F 2011-05-01 V035 219 Id_e45ccc02 54 M 2011-09-01 V035 236 Id_e45cf32c 78 M 2011-12-01 V035 256 Id_e45d19b0 51 F 2011-07-01 V035 270 Id_e45d19fb 29 M 2011-12-01 V035 289 Id_e45d4113 54 M 2012-12-01 V035 303 Id_e45d4114 54 F 2011-11-01 V035 317 Id_e45d4115 74 F 2012-01-01 V035 337 Id_e45d67c4 29 M 2011-02-01 V035 348 Id_e45d67f9 63 M 2012-05-01 V035
This tutorial will be concerned with generating a dataset that contains new entities and produces realistic event data, respecting the logic that precludes impossible pairs of events occurring consecutively. In addition, the PII such as patient ID’s and age will be masked to make the generated dataset compliant with any governance requirements.
Privacy Masking
Where masking is required, it is recommended that the privacy masks are applied to the original dataset prior to any training.
In this case, the combination of "Age" and "Sex" could be used to identify a patient (as code the value of "UID", however
we will not mask these values before synthesis as they are required by the EventSynthesizer when specifying entities. For more
information on this see the documentation on time series column specification.
At any rate, the "UID" column will not be produced when new entities are synthesized).
To generalize the "Age" column, the RoundingMask is used along with the number of bins to bucket the data into:
from synthesized.privacy import RoundingMask

rounding_mask = RoundingMask("Age", bins=5)
df_masked = rounding_mask.fit_transform(df.copy())
df_masked
UID Age Gender Date Event_Code 0 Id_e45a846f (21.999, 29.0] M 2011-02-01 V035 1 Id_e45a846f (21.999, 29.0] M 2011-02-01 8830 2 Id_e45a846f (21.999, 29.0] M 2011-02-01 0549 3 Id_e45a846f (21.999, 29.0] M 2011-02-01 0539 4 Id_e45a846f (21.999, 29.0] M 2011-02-01 5276 ... ... ... ... ... ... 359 Id_e45d67f9 (54.0, 63.0] M 2013-06-01 4610 360 Id_e45d67f9 (54.0, 63.0] M 2013-06-01 9921 361 Id_e45d67f9 (54.0, 63.0] M 2013-06-01 V035 362 Id_e45d67f9 (54.0, 63.0] M 2013-06-01 9921 363 Id_e45d67f9 (54.0, 63.0] M 2013-11-01 5276 [364 rows × 5 columns]
For a complete list of the masking capabilities available as part of the SDK see our documentation.
Precluding impossible journeys
In order to ensure that the business logic within the dataset is respected during training and generation, the
Association class can be leveraged to preclude impossible sets of events happening
consecutively. Association instances are applied between columns with a well defined relationship, however in this case
the aim is to associate pairs of events within a row. Therefore, some preprocessing of the dataset is required to ensure that
the Association class can be used here. In particular, in order to associate an event with the one immediately following it,
an additional column needs to be created, shifted such that an event and the one immediately following appear in the same row:
df_masked["Event_Code_n+1"] = df_masked.groupby(["UID"])["Event_Code"].shift(-1, fill_value="end")
df_masked = df_masked.reset_index(drop=True)
df_masked
UID Age Gender Date Event_Code Event_Code_n+1 0 Id_e45a846f (21.999, 29.0] M 2011-02-01 V035 8830 1 Id_e45a846f (21.999, 29.0] M 2011-02-01 8830 0549 2 Id_e45a846f (21.999, 29.0] M 2011-02-01 0549 0539 3 Id_e45a846f (21.999, 29.0] M 2011-02-01 0539 5276 4 Id_e45a846f (21.999, 29.0] M 2011-02-01 5276 0539 ... ... ... ... ... ... ... 359 Id_e45d67f9 (54.0, 63.0] M 2013-06-01 4610 9921 360 Id_e45d67f9 (54.0, 63.0] M 2013-06-01 9921 V035 361 Id_e45d67f9 (54.0, 63.0] M 2013-06-01 V035 9921 362 Id_e45d67f9 (54.0, 63.0] M 2013-06-01 9921 5276 363 Id_e45d67f9 (54.0, 63.0] M 2013-11-01 5276 end [364 rows × 5 columns]
Note the ordering of operations - a groupby() followed by a shift() ensures that event logs for different entities are
not mixed.
An Association instance is created between Event_Code and Event_Code_n+1, ready to be used on instantiation of an
EventSynthesizer object:
from synthesized.metadata.rules import Association

association = Association(associations=["Event_Code", "Event_Code_n+1"])
Synthesis
Similar to the TimeSeriesSynthesizer, the workflow for producing time-series data is slightly different from that when
producing tabular data because of a number of preprocessing steps that occur under-the-hood. For example, rather than
first performing a meta extraction and creating the model with the resulting meta object, the meta extraction is handled
by the EventSynthesizer itself. The reason for this is that an event-based dataset is formed of data from multiple
entities, as outlined in our documentation concerning Time-Series Synthesis, and needs to be preprocessed
before meta extraction occurs. This preprocessing ensures, amongst other things, that the interval between consecutive
events is calculated and each unique entity has the same number of time steps in the dataset.
Only after this preprocessing can the meta data be extracted.
In order to train the model with the desired number of time steps we need to specify max_time_steps in
DeepStateConfig, used to configure the underlying model. The max_time_steps argument controls
the maximum number of time steps to process from each unique entity. By default this is set to 100. In this case, it
is set to the maximum number of time steps in the event log for a single entity:
from synthesized.config import DeepStateConfig
max_time_steps = max(df["UID"].value_counts())
config = DeepStateConfig(parsing_nan_fraction_threshold=0.0, max_time_steps=max_time_steps, batch_size=5)
The argument parsing_nan_fraction_threshold is used in order to correctly interpret the Event_Code and Event_Code_n+1
columns as strings. When performing dtype inference, the SDK will attempt to cast certain column. If more than a certain
proportion of the function can be cast to a specific dtype, then that column is interpreted as that specific dtype. Most of
the values in Event_Code are integers, however there are a few genuine strings. Since it is desired that the values of this
column are understood to be strings, and the column is to be modelled categorically, the proportion of values that cannot be parsed
as integers is set to 0.
The DeepStateConfig and Association instances, along with a set of column specifications,
are then used to create an instance of the EventSynthesizer:
from synthesized import EventSynthesizer

id_idx = "UID"
time_idx = "Date"
const_cols = ["Age", "Gender"]
event_cols = ["Event_Code", "Event_Code_n+1"]

df_masked[time_idx] = pd.to_datetime(df_masked[time_idx])

synth = EventSynthesizer(
    df_masked,
    id_idx,
    time_idx,
    event_cols,
    const_cols,
    config=config,
    associations=[association]
)
synth.learn()
A set of new patients can then be created using the EventSynthesizer:
df_synth = []
for i in range(df[id_idx].nunique()):
    df_temp = synth.synthesize(n=max(df[id_idx].value_counts()))
    df_temp.loc[:, id_idx] = len(df_temp) * [i]
    first_nan_idx = df_temp["Event_Code"].isna().idxmax()
    df_synth.append(df_temp.loc[:first_nan_idx-1])
df_synth = pd.concat(df_synth).reset_index(drop=True)
df_synth
Age Gender Date Event_Code Event_Code_n+1 UID 0 (29.0, 50.0] F 2011-07-01 V035 0549 0 1 (29.0, 50.0] F 2011-07-01 0549 4610 0 2 (29.0, 50.0] F 2011-07-01 4610 0549 0 3 (29.0, 50.0] F 2011-07-01 0549 4610 0 4 (29.0, 50.0] F 2011-09-16 4610 0549 0 ... ... ... ... ... ... ... 358 (50.0, 54.0] F 2012-06-30 0539 0549 20 359 (50.0, 54.0] F 2012-06-30 0549 0539 20 360 (50.0, 54.0] F 2012-06-30 0539 4097 20 361 (50.0, 54.0] F 2012-06-30 4097 V035 20 362 (50.0, 54.0] F 2012-06-30 V035 end 20 [363 rows × 6 columns]
While the event logs in the training data were of different lengths, it is required that a number of rows, n, is
supplied in the call to synthesize(). However, by truncating the event log for each entity in the postprocessing at
the first missing value, event logs with different time steps can be generated. As mentioned above, the EventSynthesizer
preprocesses the training input such that the event logs are of the same length. It does so by padding shorter event logs with
missing values, and truncating longer event logs. As such, it is acceptable to interpret NaN values as an end token and
use them to truncate the generated data.
Evaluation
As discussed in the introduction, the evaluation of event-based data is highly domain specific and dependant on the downstream
task at hand. Numerous open-source packages are available to aid in the task of process mining (for example, pm4py). For most
data access use cases, for example where data is needed for developing feature engineering pipelines, it suffices to analyse the
aggregate metrics. Here, the cross tables between "Event_Code" and "Event_Code_n+1" will be analysed to confirm that
the generated dataset adheres to the same business logic as the original, in the sense that events that do not occur consecutively
in the original do not occur consecutively in the generated data:
from synthesized.testing.plotting.distributions import plot_cross_tables

df_masked["Event_Code"] = df_masked["Event_Code"].astype(str)
df_masked["Event_Code_n+1"] = df_masked["Event_Code_n+1"].astype(str)

df_synth["Event_Code"] = df_synth["Event_Code"].astype(str)
df_synth["Event_Code_n+1"] = df_synth["Event_Code_n+1"].astype(str)

plot_cross_tables(df_masked, df_synth, "Event_Code", "Event_Code_n+1")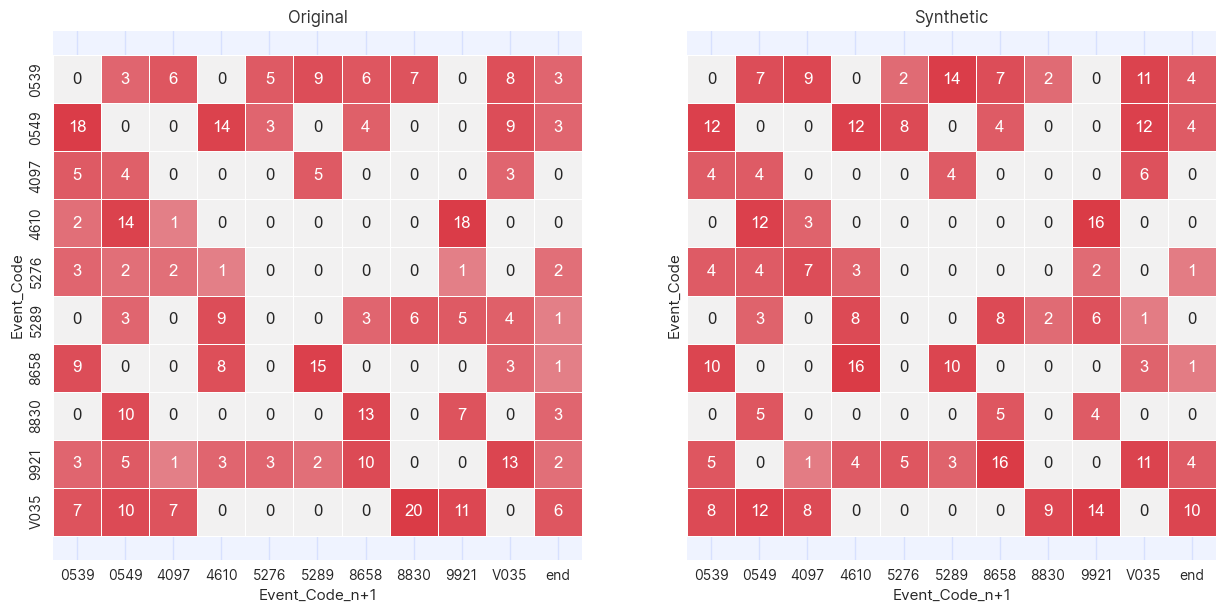
A cross table is a way of graphically showing how many times the values in two columns occur in the same row. In this case,
since the two columns being compared in the cross table are Event_Code and Event_Code_n+1, the cross table is showing
how many times one event occurs after another.
Where there are zeroes in the cross table of original data there are zeros in the generated, confirming that the Association instance
has precluded impossible journeys from occurring. Note that there are a few additional zeroes in the generated table where there
are values in the original. This is to be expected due to the (deliberately) statistically noisy procedure of generating synthetic
data. In all cases where this occurs it is due to a very small numbers of occurrences of these event pairs in the training
data.