Predictive Utility
In addition to comparing statistical metrics, Synthesized can train machine learning algorithms on the synthetic data and the original data to perform an arbitrary classification or regression task. The performance of the models on a hold-out test set of original data can be compared to determine whether the utility of the synthetic data has been maintained.
Predictive Modelling Score
Synthesized provides an API synthesized.insight.metrics.predictive_modelling_score which calculates appropriate
modelling metrics for the given dataset using the specified model. The model parameter can be either one of the
following:
-
"Linear": linear regression model -
"Logistic": logistic regression model -
"GradientBoosting": gradient boosted decision tree -
"RandomForest": random forest -
"MLP": multi-layer perceptron (feed-forward neural network) -
"LinearSVM": support vector machine
or alternatively a custom model class that inherits from the BaseEstimator together with the
sklearn.base.ClassifierMixin or sklearn.base.RegressorMixin mixins.
The function will automatically determine whether the prediction task is a classification or regression problem, and will return either the ROC-AUC or R-squared metric, respectively. All necessary preprocessing (standard scaling, one-hot encoding…) is done under the hood.
from synthesized.insight.metrics import predictive_modelling_score

target = "column_to_predict"
predictors = ["column_a", "column_b", "column_c"]

score, metric, task = predictive_modelling_score(df_original, y_label=target, x_labels=predictors, model="GradientBoosting")
Predictive Modelling Comparison
Synthesized can automatically train models and compare their performance on the original and synthetic data using the API synthesized.insight.metrics.predictive_modelling_comparison
function. It requires the original data, the synthetic data, a target variable to predict, a list of predictor columns, and a model type.
from synthesized.insight.metrics import predictive_modelling_comparison

target = "column_to_predict"
predictors = ["column_a", "column_b", "column_c"]
score, synth_score, metric, task = predictive_modelling_comparison(
    df_original,
    df_synth,
    y_label=target,
    x_labels=predictors,
    model="GradientBoosting"
)
Assessor
Similar to in the Statistical Quality, the Assessor object can be used
to visualize the performance of a given model. The following functions related to modelling can be called from an
assessor object:
-
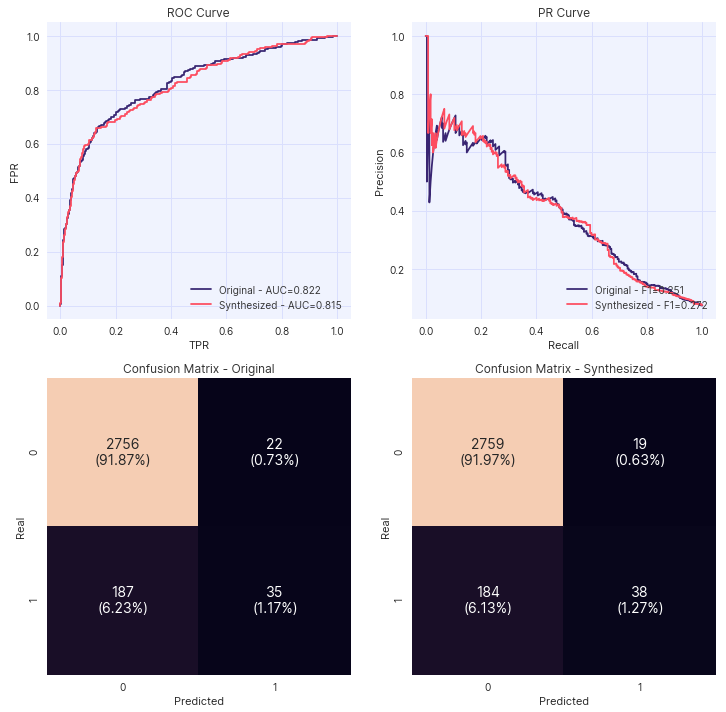
plot_classification_metrics: Plot the ROC curve, PR curve and Confusion Matrix for the given classifier trained on two DataFrames, and evaluated on the same dataset. -
plot_classification_metrics_test: Plot the ROC curve, PR curve and Confusion Matrix for the given classifier trained on the same DataFrame, and evaluated on two different datasets. -
utility: Compute utility, a score of estimator trained on synthetic data and tested on original data.
from synthesized import MetaExtractor
from synthesized.testing import Assessor
from sklearn.linear_model import LogisticRegression

df_meta = MetaExtractor.extract(df)
assessor = Assessor(df_meta)

assessor.plot_classification_metrics(
    target = "TargetColumn",
    df_orig = df_train,
    df_synth = df_synth,
    df_test = df_test,
    clf = LogisticRegression()
)

assessor.plot_classification_metrics_test(
    target = "TargetColumn",
    df_train = df_train,
    df_test1 = df_test1,
    df_test2 = df_test2,
    clf = LogisticRegression()
)

assessor.utility(df_orig=df, df_synth=df_synth, target = "TargetColumn", model = "GradientBoosting")
Example plot of assessor.plot_classification_metrics():